Weekend Review - March 30th, 2025.
🎢 Overarching Themes
- Trend: Indices in Downtrend
- AI Bubble: Still early innings, lead by themes in - AI, robotics, crypto, cybersecurity, and software.
- 3 Trillion Club & Market Cap Expansion: MSFT, NVDA, and AAPL.
- Outlook: Expecting a choppy and volatile 2025 as these trends evolve. Possibly a smoother second half of the year as uncertainty diminishes.
📊 Weekly Themes:
Pivots failed to end the week with NASI hinting at hooking lower after a very short rally. Risk off ultimately, if we get some stability in the market, and NASI holding, then we want to see the pivots below from last week hold, they remain the same.
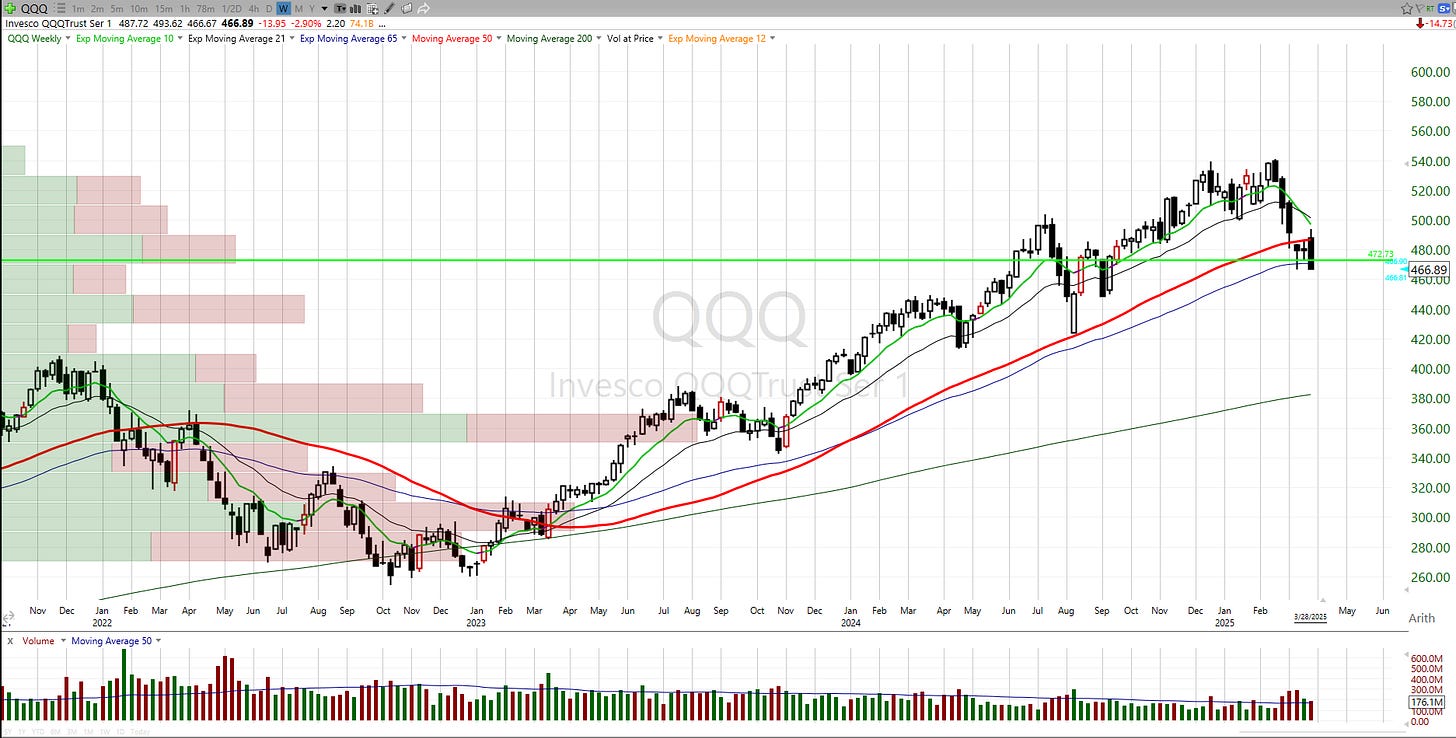
- QQQ needs to hold $472.73
- NVDA $118.42
Key Pivots:
12 month ema:
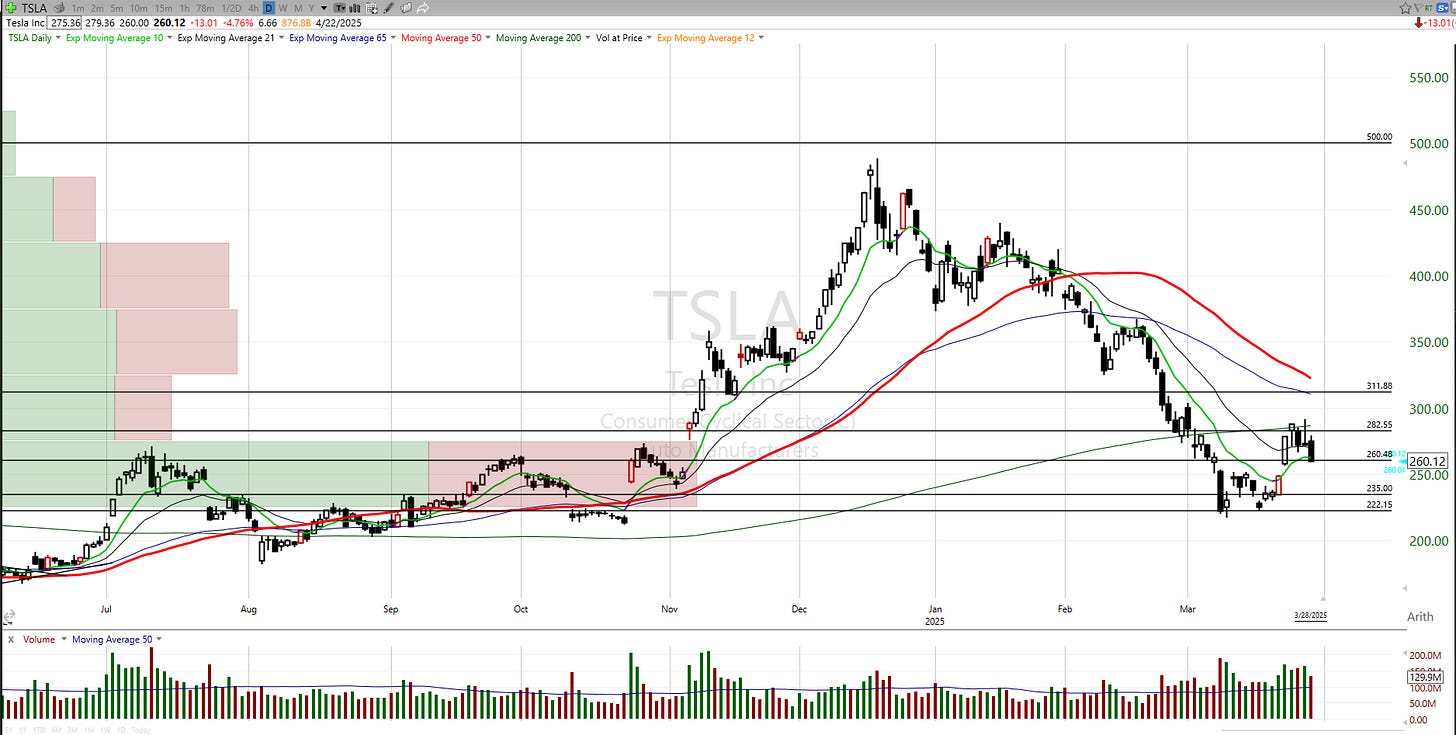
- TSLA: $282.43
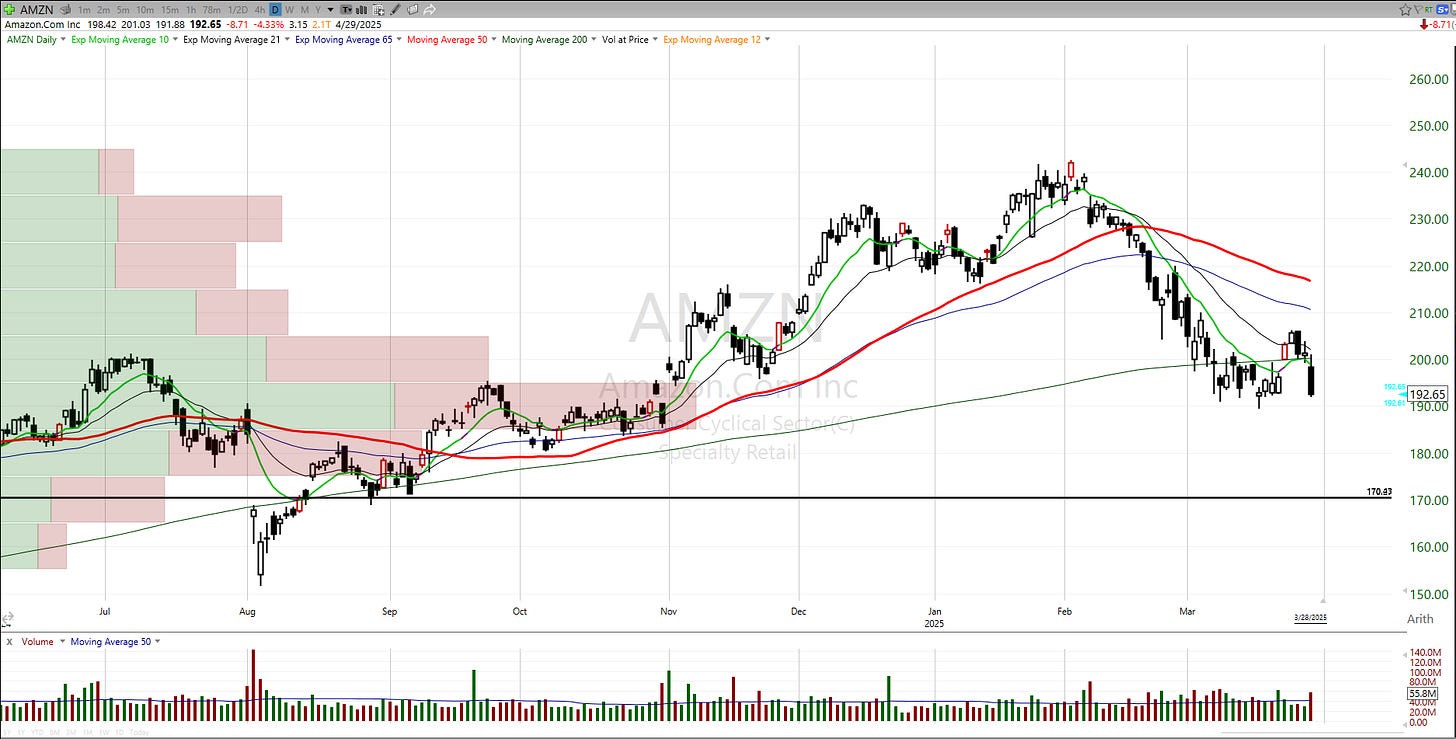
- AMZN: $195.70
- GOOGL: $169.39
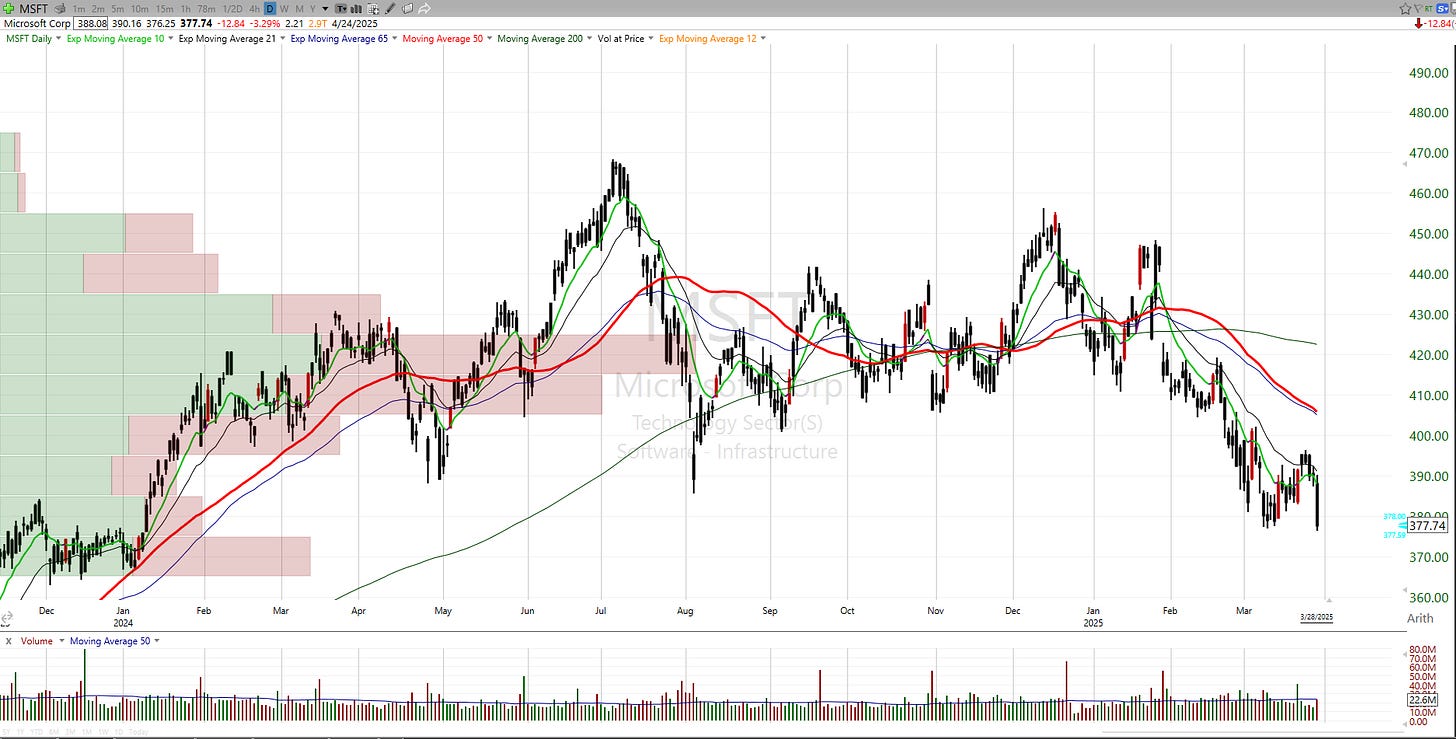
- MSFT 404.02
3 trillion market cap recoveries?
NVDA and MSFT have dipped below, they’d recover these levels at:
- NVDA: $122
- MSFT: $403.77
📆 Events
Economic Calendar:
- Monday: Chicago PMI
- Tuesday: Manufacturing Data + JOLTS (Feb)
- Wednesday: ADP Non farm employment change (Mar), Factor orders, Crude Inventories
- Thursday: OPEC Meeting, Jobless Claims, Trade balance, Fed’s Balance Sheet.
- Friday: Jobs Data, Fed Speakers
Thoughts:
McClellan Oscillator Analysis:
- Current Reading: -53.01
- NASI: 37.91
- Interpretation: Despite the NASI hooking higher 3/14ish, it’s now looks like it wants to hook back down. Half backed rallies of the NASI can be dangerous, and this was confirmed by indices rallying into the 200sma and revisiting lows fairly broadly.
The market’s inability to rally is evident. The pivots we’ve highlighted over the last few weeks have failed. The NASI hooked higher but is now hinting at a hook lower. Odds are still split on whether it has more room or not, but current action suggests a sloppy, grinding environment rather than an easy dollar scenario.
I haven’t discarded the NASI hook just yet, but the price action can’t be ignored. Despite some initial holds, we rallied into hurdles and failed aggressively. My overarching thesis remains focused on an AI bubble, but the market and liquidity suggest it isn’t ready. Our primary indicator for the AI bubble is NVDA, and it’s simply not materializing—price isn’t lying to us, and its inability to hold pivots and clear hurdles is noted.
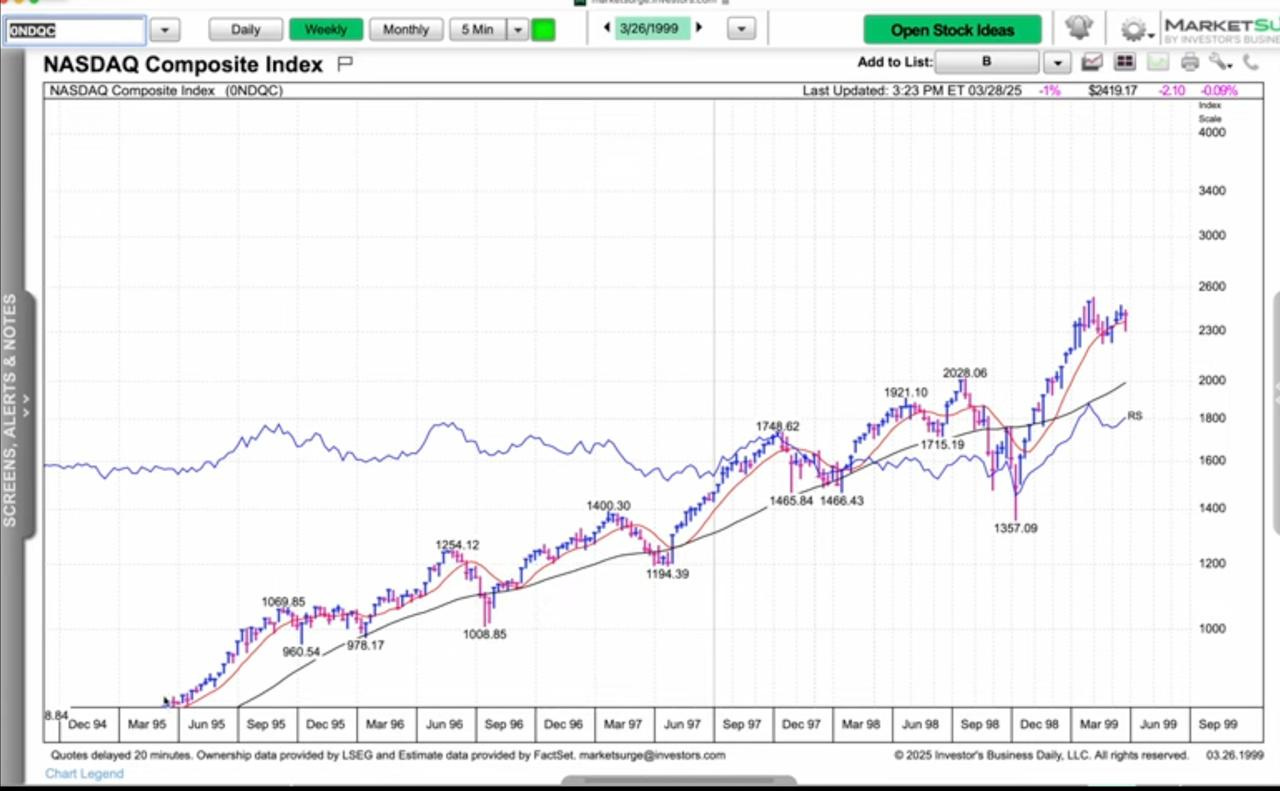
The last bubble comparable to the one we’re discussing now is the dot-com bubble, where we rallied into $2000 and failed hard in 1998, and then rallied in historic fashion. Will history repeat itself in identical fashion? Who knows. However, given my strong conviction that an AI bubble is brewing, I believe this scenario is the most likely—at least to me.
On a weekly chart, the $2,000 top then corresponds to the $20,000 top of today in the Nasdaq.
**Indices:
**To keep things as simple as possible, I’m going to keep the analysis super tight and easy to follow.
Last week, we focused on two key levels for QQQ: the 12-month level around $480 and the $473-ish HVC. Both failed—price action doesn’t lie, and it’s clear the market simply isn’t ready. Until we reclaim these levels, it’s a risk-off environment. Even short-term rallies to these levels need to be confirmed by a sustained NASI hook that holds for more than a day, supported by broader market strength.
Institutional Stocks:
One of our overarching views was a market cap expansion to $3 trillion and beyond, focusing on MSFT, NVDA, and AAPL. The idea was that if an AI bubble were brewing, these names could reach $5-10 trillion in a bubble scenario. However, as of Friday, the market has proven this hypothesis wrong—at least in the short term. Over the past few weeks, both MSFT and NVDA have broken below $3 trillion and failed to reclaim those levels.
We also highlighted GOOGL and AMZN at $2 trillion, but GOOGL has fallen below this mark, while AMZN is hanging on by a thread. AAPL remains above $3 trillion, but it faces challenges if it drops below the $209 HVC. Additionally, we emphasized the importance of these stocks reclaiming their 12-month EMA, which has been our trend guide for over seven years. Unfortunately, none were able to recover it. Here are the key levels from last week:
- TSLA: $282.43
- AMZN: $195.70
- GOOGL: $169.39
- MSFT: $404.02
For institutional names, we need to see these market caps and 12-month EMAs regained before we can become more optimistic, or at the very least, observe some form of bottoming pattern. For now, these are the critical levels unless a steep correction occurs.
TSLA a one week rally after 9 weeks down.
AMZN closing right at 2 trillion, failed the 12 month recovery, and right back a recent lows.
MSFT fresh lows and a few weeks under 3 trillion now and a rejection of the 12 month.
Again, need to recover these levels in the short term to get long.
Growth Stocks:
Given everything mentioned above, it’s best to avoid discussing growth names in detail for now. However, if some of the key levels highlighted earlier hold early this week—say Monday or Tuesday—refer back to last weekend’s review for the pivots.
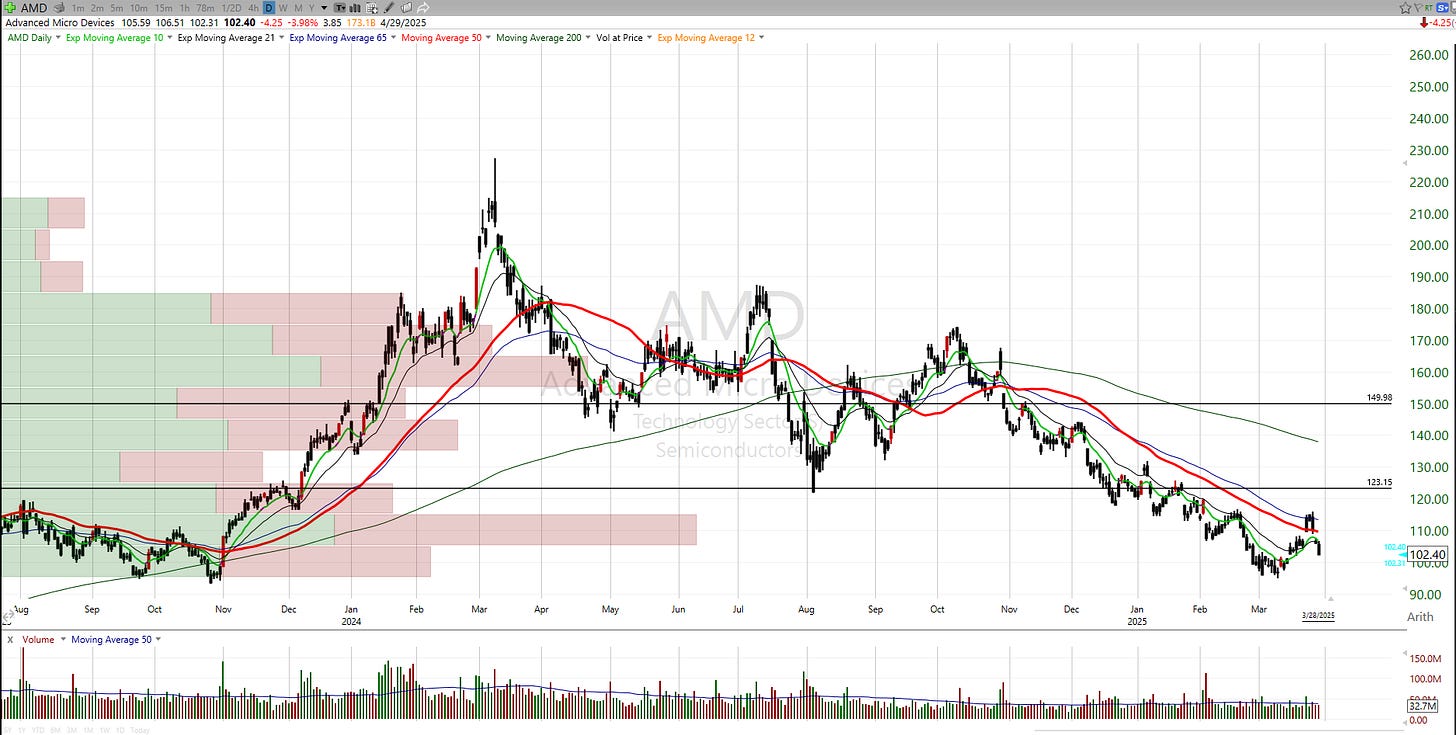
A straightforward example is AMD:
- We identified $112 as a critical level, and it failed dramatically last week.
- $100 remains in play as a potential support level.
Summary:
The outlook for growth stocks remains cautious until key levels in institutional stocks are reclaimed. If we see early strength this week, a closer look at growth names may be warranted, but patience is advised.
Nice!
Support is all we need 🙌 @marionawfal @keysisay @gdphotography @cloutexhibition
